


Research Questions/Objectives:
Question 1: How has mangrove area changed through time (gain/loss, edge movement)?
Hypothesis 1: Largest changes coincide with major flood regime shifts (e.g. Burdekin floods), cyclones, and shoreline erosion/accretion pulses.
Question 2: How has canopy height and structure changed?
Hypothesis 2: Sites with sustained sediment accretion show increasing canopy height, while exposed shorelines show suppression or dieback.
Question 3: What landscape and ocean drivers best explain change?
Hypothesis 3: Distance to river mouths, tidal range/exposure, shoreline change rate, and extreme events explain most variance.
Brief Description of the Project:
This project will use multi-temporal LiDAR, drone-based photogrammetry, and satellite remote sensing to assess long-term structural change and climate-driven vulnerability in key coastal vegetation communities across Tropical North Queensland. By analysing canopy height, density, spatial coverage, and dieback indicators over time, the project will identify how drought, reduced freshwater inflows, heat extremes, and broader climate variability shape ecosystem resilience.
Field validation and site-specific data will be integrated with historical elevation, hydrological, and climatic records to develop a clearer understanding of vegetation vulnerability thresholds. The outcomes will demonstrate how remote sensing technologies can provide high-resolution, repeatable monitoring tools that support drought preparedness and adaptive land management across coastal and agricultural landscapes.
Background and Significance of the Research Question to drought risk, vulnerability, preparedness, or resilience:
Coastal vegetation including mangroves, saltmarshes, and riparian communities’ plays a critical protective role for agricultural regions by stabilising coastlines, impacting water quality, and acting as a buffer to weather impacts. However, these ecosystems are becoming increasingly exposed to climatic pressures such as prolonged drought, reduced river discharge, elevated temperatures, and shifting salinity regimes. Recent severe mangrove dieback events across northern Australia highlight how climate variability can rapidly destabilise vegetation communities that agriculture and coastal towns rely on. Understanding long-term vulnerability and resilience is therefore essential for drought-ready land management.
My research aligns strongly with TNQ Drought Hub priorities by improving understanding of climate driven vegetation decline and thresholds, supporting early-warning indicators for drought stress, applying innovative remote sensing technologies for landscape-scale monitoring, informing catchment managers, agricultural stakeholders, and councils about coastal ecosystem health and resilience and finally contributing to proactive planning that reduces risk for regional communities and industries.
Academic and research experience relevant to the honours project:
Throughout my Bachelor of Marine Science at JCU, I have built strong skills in coastal ecology, environmental monitoring, GIS, and spatial data analysis. My coursework and field-based training have included ecosystem surveying, vegetation identification, hydrology, sediment processes, and coastal geomorphology.
I have previous work experience as a casual research assistant at TropWATER, where I have gained experience in geospatial analysis, remote sensing workflows, ecological monitoring, and data management. I have worked on projects involving drone imagery, benthic mapping, and environmental assessments, which has strengthened my technical abilities and attention to detail.
I also have had the privilege in gaining additional experience using tools and technologies highly relevant to this project, including drone surveying and aerial imagery interpretation, LiDAR scanning (terrestrial and handheld), Agisoft Metashape, CloudCompare, QGIS, and ArcGIS Pro, analysis of satellite datasets (Sentinel-2, Landsat), fieldwork including water quality sampling, vegetation surveys, and species assessments.
Principal Supervisor’s skills and experience in relation to this project topic:
Professor Rafael Cabral Carvalho is a leading researcher in remote sensing, environmental monitoring, and climate driven marine geoscience change. His expertise includes LiDAR analysis, aerial photography-based mapping, coastal and catchment processes, and modelling environmental responses to climate variability. He has experience supervising Honours, MSc, and PhD students across disciplines involving spatial analysis, environmental change detection, resilience assessment, and geospatial technology. His research strongly aligns with drought resilience, climate adaptation, and innovative monitoring tools for northern Australian environments.
Professor Carvalho’s background ensures strong methodological guidance in multi-temporal LiDAR and satellite data integration, ecosystem vulnerability assessment, climate and hydrological impact analysis, geospatial modelling and interpretation, linking scientific outcomes with real-world management applications. His expertise is highly suited to the aims of this project and the priorities of the TNQ Drought Hub.
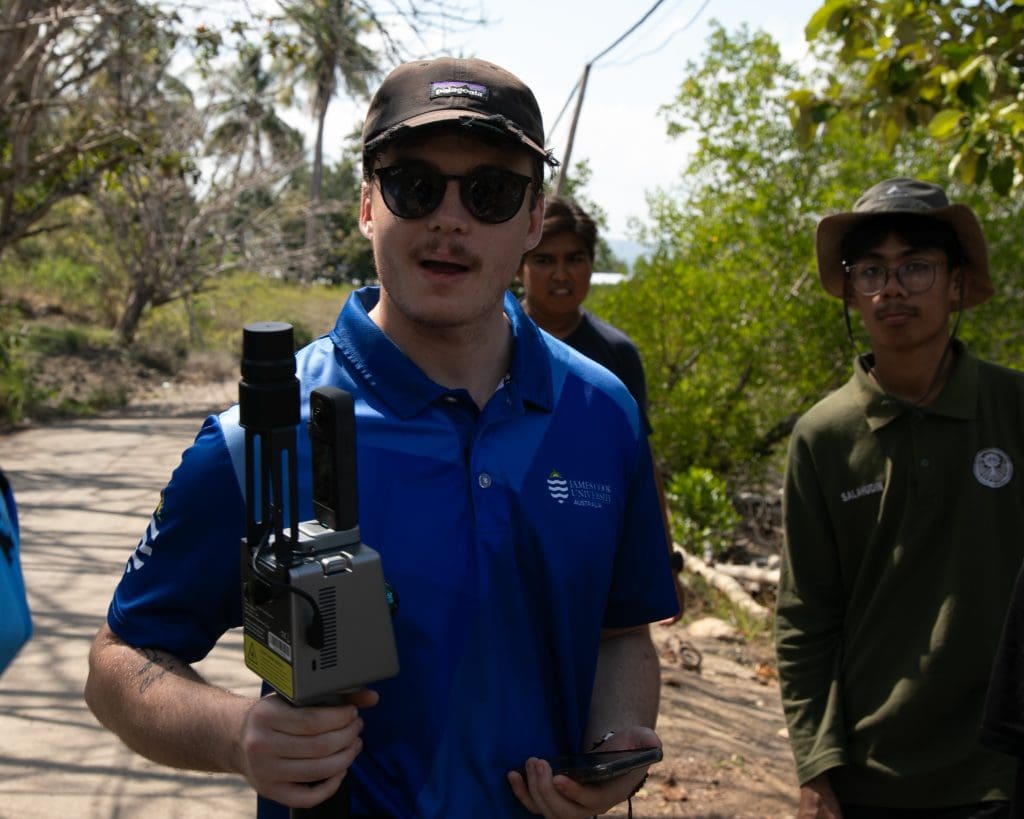
My name is Leo and I am an Honours student at James Cook University studying Marine Science. Originally from West Melbourne, my passion for the ocean began at a young age while snorkelling in Port Phillip Bay. Those early experiences exploring coastal ecosystems sparked a fascination with marine life and the importance of protecting these environments. Growing up, I spent as much time outdoors as possible and developed a strong interest in conservation and environmental science. This passion led me to pursue a Bachelor of Marine Science at James Cook University, where I have been able to explore the incredible marine environments of North Queensland and the Great Barrier Reef.
My Honours research focuses on multi-temporal mapping of mangrove forest change and structure along the North Queensland coastline using remote sensing technologies. I am particularly interested in how emerging technologies such as satellite imagery, LiDAR, and other remote sensing tools can be used to better monitor and protect coastal ecosystems. By combining conservation science with developing technology, I hope to contribute to more effective ways of understanding and managing environmental change. Outside of my studies, I enjoy travelling and spending time in nature, whether that’s diving, hiking, or exploring new environments. I am also passionate about wildlife photography and videography, which allows me to document and share the beauty of the natural world.
Future Career Goals:
Looking ahead, my goal is to continue working in marine conservation and research, using innovative technologies to help better understand and protect vulnerable coastal ecosystems.
Project overview
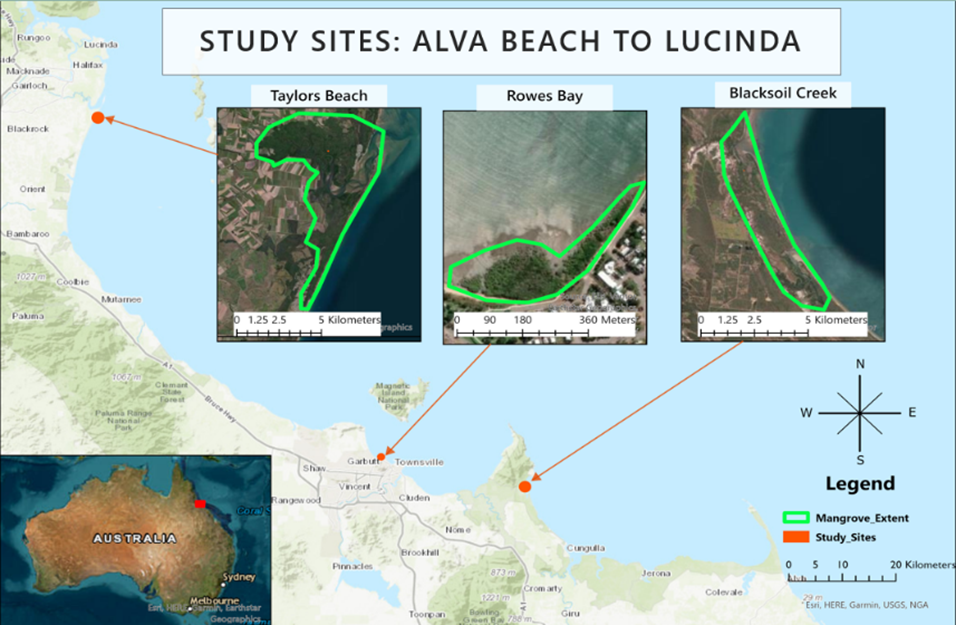
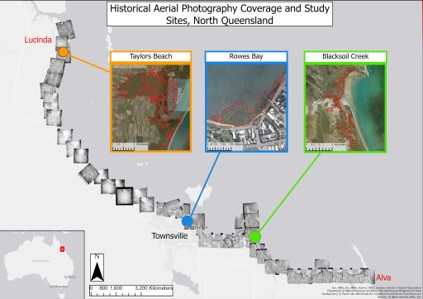
Mangrove forests are important coastal ecosystems that stabilise shorelines, store carbon, support fisheries and protect low-lying coastal communities from storms. In North Queensland, these functions are directly relevant to drought resilience and agricultural sustainability because mangroves form a natural buffer between coastal catchments, cane farms, drainage channels and the Great Barrier Reef lagoon. Their condition is influenced by freshwater inflow, salinity, sediment delivery, cyclones, sea-level rise and land-use change. This project investigates how mangrove extent and canopy structure have changed between Townsville and Lucinda, with sites at Rowes Bay (RB), Blacksoil Creek (BC) and Taylors Beach (TB).
Methods and progress so far
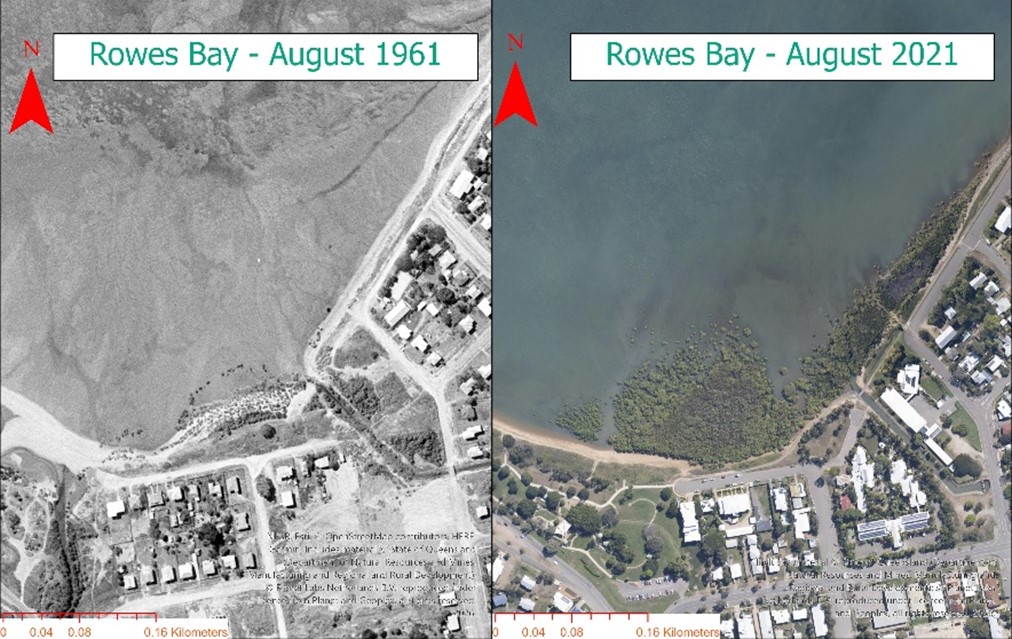
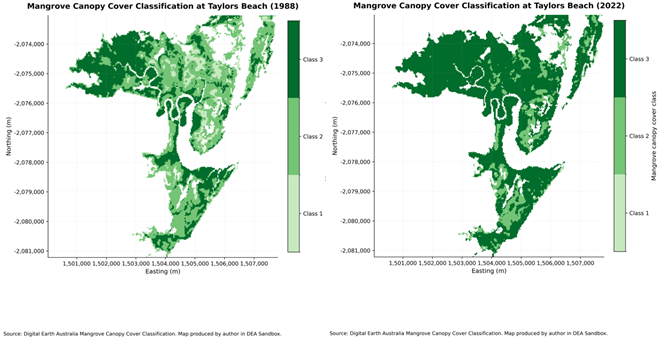
Preliminary analysis combines historical aerial photography from QImagery with the Digital Earth Australia mangrove canopy cover dataset developed by Lymburner et al. (2020). Historical imagery was used to assess long-term mangrove extent change between 1961 and 2022, while canopy cover classifications were used to compare forest density between 1988 and 2022. The sites differ in freshwater influence, sediment supply and surrounding land use, including areas connected to agricultural catchments. These contrasts allow the project to assess where mangroves are acting as stable coastal buffers, and where drought, altered flows or sediment/nutrient delivery may be affecting forest condition. Later stages will validate the remote sensing outputs with terrestrial LiDAR, drone imagery and field inventory measurements.
Preliminary results and link to drought resilience
Rowes Bay: Preliminary digitising indicates an approximate 640% increase in mapped mangrove canopy extent between 1961 and 2022. This expansion likely reflects sediment accumulation, shoreline processes and local hydrological change. From a Drought Hub perspective, this matters because a larger mangrove fringe can reduce wave energy, stabilise soft shorelines and buffer nearby coastal infrastructure and low-lying land during extreme rainfall, storm tide and post-drought flood events.
Taylors Beach: Mangrove canopy classifications indicate a shift towards denser canopy between 1988 and 2022. Denser canopy suggests improved structural condition, which is important for coastal agriculture because mangroves can trap sediment, slow runoff, filter nutrients and reduce erosion along drainage pathways connected to cane-growing landscapes. These services support sustainable production by helping protect farm edges while reducing downstream water-quality pressure.
Blacksoil Creek: Preliminary observations show more spatially variable canopy change. This site may be more sensitive to altered freshwater delivery, salinity stress, catchment runoff and sediment movement. Mapping this variability helps identify where mangrove buffers may be vulnerable and where management actions such as maintaining flows, protecting wetlands or reducing sediment/nutrient loads could improve resilience.
Conclusion and next steps
Overall, the early findings show that mangrove change is not uniform across the study region: RB shows strong long-term expansion, TB shows increasing canopy density and BC shows more variable local change. These patterns are directly relevant to drought resilience and agricultural sustainability because mangroves help buffer cane farms and coastal agriculture from erosion, salinity intrusion, storm impacts and variable catchment runoff. The next phase will refine the change maps and use LiDAR, drones and field measurements to determine whether mapped changes represent stronger protective buffers or early signs of stress. This will provide practical information for land and water managers seeking to maintain productive coastal agriculture while improving wetland, reef and regional climate resilience.
Multi-Temporal Mapping of Mangrove Forest Change and Structure along the North Queensland Coast using Remote Sensing
Background
Mangrove forests are crucial components of tropical North Queensland’s coastal landscape. They stabilise shorelines and creek margins, trap sediment, cycle nutrients, support fisheries and protect low-lying coastal areas. These ecosystem services also contribute to drought resilience and agricultural sustainability because cane farms, drainage networks, floodplains, creeks, mangroves and coastal waters are connected through catchment flows.
During periods of drought, reduced freshwater inputs may increase salinity stress in coastal ecosystems. In contrast, when rainfall returns, runoff can rapidly transport water, sediment and nutrients downstream. Monitoring how mangrove forests respond over time can therefore provide useful information about the condition of coastal buffers at the downstream end of productive agricultural catchments.
Aim:
This research examines how mangrove extent, canopy cover and forest structure have changed across three contrasting coastal sites. Rowes Bay, an urban-adjacent mangrove forest, Blacksoil Creek, a dynamic natural system; and Taylors Beach, an agriculture adjacent site within the Herbert catchment. The project combines historical aerial photography from before the satellite era, Digital Earth Australia’s Landsat-derived Mangrove Canopy Cover product, airborne LiDAR, multispectral drone imagery and field inventories. Each dataset reveals a different aspect of change, showing not only where mangroves occur, but also how their boundaries, canopy cover and three-dimensional structure have changed over time.
Key Findings
The three sites followed distinct long-term trajectories. Mapped mangrove extent increased by 60.2% at Rowes Bay between 1961 and 2022 and by 34.0% at Blacksoil Creek between 1961 and 2019. At Taylors Beach, mapped extent was 6.2% lower in 2021 than in 1961, however, the stronger pattern was substantial spatial redistribution around channels and shoreline edges.
A key finding is that mapping total mangrove area alone does not provide a complete assessment of forest conditions. Mangrove forests are dynamic environments: their boundaries may shift, canopy cover may become more dense or more open, and forest structure may change even when the total mapped area remains relatively stable. Therefore, integrating multiple remote-sensing techniques with field-based inventories provides a more comprehensive assessment of ecosystem structure and condition.
Practical Applications
The primary practical outcome of this research support a targeted monitoring approach. Broad scale satellite data is analysed first to identify hotspots where change is occurring, followed by detailed surveys where they are needed. The main applications for industry and regional managers are as follows:
Freely available satellite datasets, such as Digital Earth Australia’s Landsat-derived Mangrove Canopy Cover product developed by Lymburner et al., enable large coastal areas to be efficiently screened for potentially significant changes in mangrove extent and canopy condition. This cost-effective approach helps identify and prioritise potential hotspots before personnel and equipment are committed to targeted field surveys.
Following broad-scale screening, coastal managers can concentrate high-resolution drone and LiDAR surveys, supported by targeted field measurements, on identified hotspots rather than applying intensive monitoring across the entire coastline. This tiered strategy provides a more focused and cost-effective monitoring framework, ensuring limited resources are directed towards areas of greatest management concern.
The same workflow can be repeated following droughts, extreme wet seasons or severe storms to detect patterns of ecosystem stress, recovery and rapid change. By building a consistent record over time, repeated monitoring provides a robust evidence base for climate-adaptation planning and management decisions, rather than relying on a single snapshot of mangrove extent.
Multi-temporal maps of mangrove extent can then be assessed alongside rainfall, streamflow, agricultural drainage, erosion, land-use and water-quality data. Although these comparisons cannot establish that a particular catchment pressure caused an observed change, they can reveal spatial and temporal associations and indicate where hydrological or agricultural processes warrant further investigation.
Because much of the satellite information already exists and is regularly updated, the same approach can be applied to other coastal agricultural catchments across North Queensland. A consistent structured workflow can build comparable evidence through time and support future planning.
Taylors Beach: Agricultural Relevance
Taylors Beach provides the clearest agricultural case study because it lies within the Herbert catchment, where extensive sugarcane production occurs inland of the coastal mangrove system. The mapped record shows substantial redistribution of mangrove cover around channels and shoreline edges. Catchment information identifies agricultural drainage and streambank erosion as potential pathways by which nutrients and fine sediment may reach coastal environments.
These results do not demonstrate that agriculture caused the mapped changes. Rather, they show why agricultural catchment management and coastal monitoring should be considered together: remote sensing identifies where change is occurring, while catchment information helps determine what should be investigated next.
Relevance to the TNQ Drought Hub
Climate Adaptation: Repeated monitoring provides earlier evidence of how coastal buffers respond to drought, flooding, cyclones and changing freshwater conditions.
Innovation and Technology: The approach turns existing Earth-observation data into practical screening information which is then complemented by the use of higher resolution data from multispectral drones, LiDAR and field surveys only where more detail is needed.
Regional Capacity: A repeatable workflow could be used by local managers, NRM groups, councils and industry to build a consistent evidence base through time.
Operational Considerations and Limitations
Remote sensing is most useful as a screening and monitoring tool rather than a stand-alone explanation of cause. Satellite products can miss narrow mangrove fringes, historical photographs vary in quality, and LiDAR and field surveys are not always available for the same years. Tide, image quality, spatial resolution and the timing of observations can also influence mapped results.
For this reason, the monitoring approach should combine several evidence sources and use field or drone checks where satellite information is uncertain. Droughts, floods, cyclones or changes in land use should be treated as possible explanations only where the timing and location of the evidence support that interpretation.
Next Steps
The next stage is to complete the remaining field validation and finalise comparisons between remote-sensing outputs and forest measurements. Future work could automate parts of the satellite screening workflow, expand the method to additional coastal agricultural catchments and combine mangrove monitoring more directly with rainfall, streamflow, water-quality and land-management datasets.
With further development, this approach could give land and water managers a practical way to identify priority areas for closer investigation, track change through time and direct monitoring resources more efficiently.
Conclusion
The value of this research lies not simply in producing better mangrove maps, but in using existing information more effectively to support smarter monitoring, targeted management and more resilient coastal catchments that support sustainable agriculture.
Acknowledgements
This research is supported by the TNQ Drought Hub and James Cook University. I gratefully acknowledge the financial support provided through the TNQ Drought Hub scholarship and the guidance of my supervisors Rafael Carvalho, Ben Jarihani and Nathan Waltham.